Building a Weekly Mining Report From Pool Statistics
A weekly report is the cheapest control any mining operation can add, and the arithmetic behind it is short. To earn 0.001 BTC a day at the read-date network hashrate and difficulty you would need about 2,229 TH/s; a 500 TH/s fleet reaches the same 0.001 BTC in about 4.5 days, and a 5 TH/s hobby rig needs roughly 446 days. The report's job is to tell you, once a week, which of those curves your operation is actually on.

Key takeaways
- Six fields are enough: effective hashrate, share acceptance, uptime, BTC credited, the USD value at a fixed reading time, and the difficulty change over the week.
- At 5 TH/s, one week of mining produces about 0.0000157 BTC — around $1.33 — which is small enough that a single offline day dominates the report's variance.
- At 2 PH/s, the same week produces roughly 0.00628 BTC, about $531.91 gross and $510.63 after the listed 4% fee on the block-reward component.
- Read pool statistics weekly for cash flow and daily only when reconciling uptime; the underlying numbers do not move fast enough to justify a daily ritual.
The core idea
Mining income is a product of four quantities: your effective hashrate, your share of network hashrate, the network's daily issuance, and the fee applied to what you are paid. The network side moves slowly and publicly — 450 BTC a day across 144 blocks at a 3.125 BTC subsidy, difficulty at 132.76 T on the read date, and a difficulty estimate of −2.12% for the next adjustment. The operation side is where variance actually lives.[1]
That asymmetry is the whole argument for a fixed weekly report. When the network is stable and the fleet is healthy, the report reads the same every week and takes ten minutes. When it does not read the same, the difference is almost always a machine, a link, or a settlement rule — and it is far easier to find on a single page than by scrolling through a live dashboard.
What goes in the report
| Field | Where it comes from | Illustrative weekly value | What a change means |
|---|---|---|---|
| Effective hashrate | Pool worker view, averaged over the week | 500 TH/s | Below nominal means throttling, stale shares or a partial outage |
| Share acceptance | Submitted versus accepted shares | Above 99% | A persistent gap is a network path problem, not a hardware one |
| Uptime | Worker-online time divided by clock time | 98% or better | Each lost percent removes about 1% of income |
| BTC credited | Settlement records | About 0.00157 BTC | Compare against hashrate share times 450 BTC a day |
| USD value | One price, read at a fixed hour | About $132.98 | A fixed reading time is what makes week-to-week comparison honest |
| Difficulty change | Public chain data, per adjustment | −2.12% estimated | Shifts income per share by roughly the inverse amount |
Note what is not on the list: the pool's headline hashrate, the current price of anything else, and any projected annual return. Those either duplicate information already in the report or introduce a variable that no weekly decision depends on.
How it plays out at scale
The same six fields work at every size, but the noise floor changes. At 5 TH/s a week is 0.0000157 BTC, about $1.33, which means one offline afternoon is a large percentage of the total and the report should be read on a four-week rolling basis rather than week by week.
At 500 TH/s the weekly figure is about 0.00157 BTC — roughly $132.98 — and single-machine faults become visible without dominating. At 2 PH/s the week is about 0.00628 BTC, around $531.91 gross and $510.63 after the listed 4% fee on the block-reward component. That is scale enough to reconcile against an electricity bill: 2 PH/s of 20 J/TH hardware draws 40 kW, or 960 kWh a day, about $403 a week at $0.06 per kWh, leaving roughly $107 a week of margin in this example.
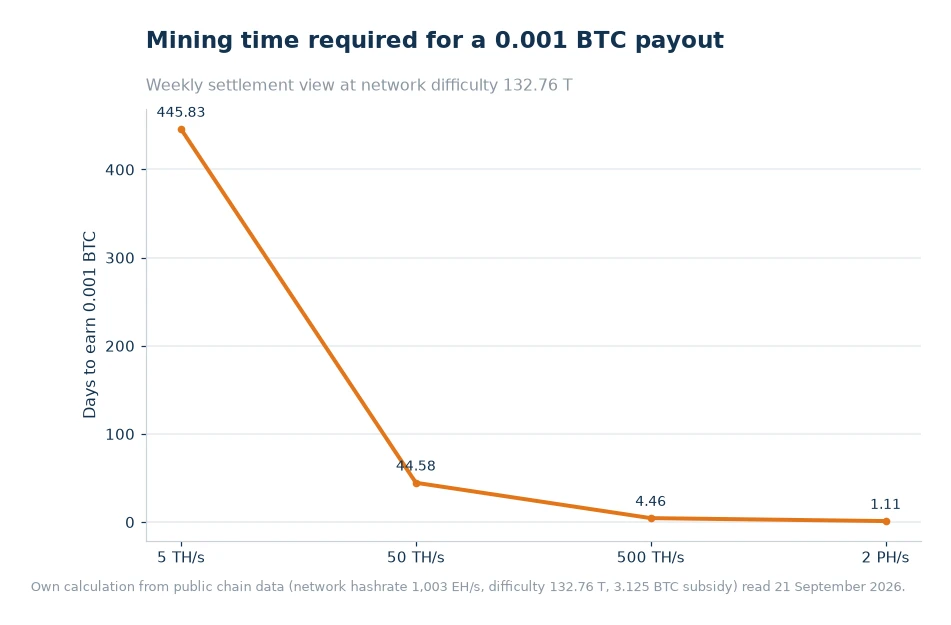
The chart makes the reporting cadence decision for you. A fleet that reaches 0.001 BTC in 1.1 days produces enough data points per week to see a trend; one that needs 446 days does not, and should be reported monthly with the same fields.
Two scenarios compared
Scenario A: a single 5 TH/s machine running from home. Weekly output is about 0.0000157 BTC, roughly $1.33 gross and $1.28 after the listed 4% fee. At 20 J/TH the machine draws 100 watts, or 2.4 kWh a day, which is about $0.14 a day of electricity at $0.06 per kWh. The report's real value here is not the income line; it is catching the week the machine silently drops offline and stops crediting shares at all.
Scenario B: a 2 PH/s hosted deployment. Weekly output is about 0.00628 BTC, roughly $531.91 gross, and the power cost is about $403. The report's value here is different: at this scale a 2% slice lost to stale shares or thermal throttling is worth about $10.60 a week, which is exactly the kind of drift a weekly page makes visible before it becomes a quarterly surprise.
Both scenarios use the same template, the same field order and the same reading hour. That consistency is what allows a farm to hand the report to a host, a lender or an accountant without rewriting anything.
Common failure modes
- Reporting nominal hashrate. A fleet's label figure is not what was credited; the pool's worker view is.
- Valuing BTC at a different hour each week. Two reports that use different reading times are not comparable, and the difference is easy to mistake for performance.
- Comparing months of different lengths. Seven-day windows reconcile; calendar months do not, unless the daily rate is normalised first.
- Ignoring the fee components. The listed 4% applies to the PPS-settled block-reward component and 2% to the PPLNS-distributed components, so a fee line copied from a headline number will not reconcile against settlements.[2]
- Treating a quiet week as a good week. A week with no alert and a 3% hashrate decline is two problems, not one.
Build the report once, then reuse the tooling. An income calculator gives the expected daily figure for the reconciliation column, and a miner profitability ranking tells you whether a machine that has dropped below its electricity cost should be repaired, re-profiled or retired — a decision the weekly report should surface rather than hide.
The source data for the network side of the page is published per coin on the ViaBTC BTC Mining Pool statistics view: pool hashrate, network hashrate, difficulty and miner counts, all of which belong in a footnote rather than the headline of your own report.
Frequently asked questions
How often should a miner check pool statistics?
Weekly is enough for cash flow, daily if you are reconciling worker uptime or chasing a hashrate fault.
Does the payout method change my average income?
It changes the variance and the fee, not the underlying expected value: your share of network hashrate still sets the ceiling.
What should a weekly mining report include?
Effective hashrate, share acceptance, uptime, the BTC credited over the week, that BTC valued at one fixed reading hour, and the difficulty change since the previous report.
Why does my weekly report disagree with the monthly total?
Usually because of valuation timing or month length. Seven-day windows with a fixed reading hour reconcile; comparing a 28-day month against a 31-day one without normalising the daily rate does not.
The short version
Pick six fields, one reading hour and one page. Fill it in weekly, reconcile the income line against hashrate share times daily issuance, and read the difficulty change as context rather than news. At 5 TH/s the exercise catches outages; at 2 PH/s it catches margin drift worth about $10.60 a week per lost percentage point. Either way it takes ten minutes and replaces an hour of dashboard scrolling.
Data and sources: ViaBTC fee schedule and pool documentation[1] and ViaBTC pool statistics[3]. Network hashrate, difficulty, subsidy and BTC price read from public chain data on 21 September 2026. Figures are illustrative and change with difficulty and price.